推荐阅读
机器学习笔记10——EM算法原理与详细推导
| issey的博客 机器学习笔记11——【GMM
1】高斯混合模型原理与推导 | issey的博客
前言
前几天忙着开学的事,加上图像处理的学习,这篇文章稍微搁置了些时间。闲话不多说,直接进入正题。本篇对EM算法和高斯混合模型的推导过程不会再详细说明,相关部分请见前两篇文章。
高斯混合模型的聚类步骤
回顾在上一篇文章结尾,GMM聚类步骤为:
step1:
定义高斯分布个数K,对每个高斯分布设置初始参数值\(\theta^{(0)}_k = \alpha_k,\mu_k,\Sigma_k\)
。一般第一步不会自己设置初始值,而是通过K-mean算法计算初始值。
step2 E-step:
根据当前的参数\(\theta^{(t)}\)
,计算每一个隐变量的后验概率分布\(\gamma_t(z^{(i)})\) 。精确到每一个后验概率的计算,有
\[
\gamma_t(z_k^{(i)}) =
\frac{\alpha_k^{(t)}N(x|\mu_k^{(t)},\Sigma_k^{(t)})}{\sum_{j=1}^K
\alpha_j^{(t)}N(x|\mu_j^{(t)},\Sigma_j^{(t)})}
\]
这里解释一下:
\(\gamma_t(z_k^{(i)})\)
:在第t轮时,第i个样本的隐变量z的第k个概率。或者说,在第t轮时,第i个样本属于第k个高斯分布的后验概率。\(\alpha_k^{(t)}\) :在第t轮时,已固定的 第k个高斯分布的权值。\(N(x|\mu_k^{(t)},\Sigma_k^{(t)})\)
:在第t轮时,第k个已固定的 多维高斯分布概率密度函数。带上标(t)的都是已固定参数 。
step3 M-step:
根据E-step计算出的隐变量后验概率分布,进一步计算新的\(\theta^{(t+1)}\)
\(\alpha_k^{(t+1)} =
\frac{1}{N}\sum_{i=1}^n\gamma_t(z^{(i)}_k)\)
\(\mu_k^{(t+1)} =
\frac{\sum_{i=1}^n[\gamma_t(z^{(i)}_k)x_i]}{\sum_{i=1}^n\gamma_t(z^{(i)}_k)}\)
\(\Sigma_k^{(t+1)} =
\frac{\sum_{i=1}^n\gamma_t(z^{(i)}_k)(x_n-\mu_k)(x_n-\mu_k)^T}{\sum_{i=1}^n\gamma_t(z^{(i)}_k)}\)
step4:
循环E-step和M-step直至收敛。
代码实现
前置说明
由于多维高斯分布概率密度函数对于个人而言不太好实现(其实是因为没学,可能后面会开一篇文章讲多维高斯分布概率密度函数的计算),所以这里就以服从一维高斯分布的数据作为手动代码实现的训练集。即训练集只有一个特征。
数据生成
这里使用sklearn的make_blobs函数生成数据。
make_blobs聚类数据生成器
scikit中的make_blobs方法常被用来生成聚类算法的测试数据,make_blobs会根据用户指定的特征数量、中心点数量、范围等来生成几类数据。
其中:
n_samples是待生成的样本的总数
n_features是每个样本的特征数
centers表示聚类中心点个数,可以理解为种类数。当centers为列表时,为每个类别指定中心位置。
cluster_std设置每个类别的方差
random_state是随机种子
下面将通过两个例子来直观说明make_blobs函数。
绘制数据时会用到plt.hist函数,详见python--plt.hist函数的输入参数和返回值的解释 。
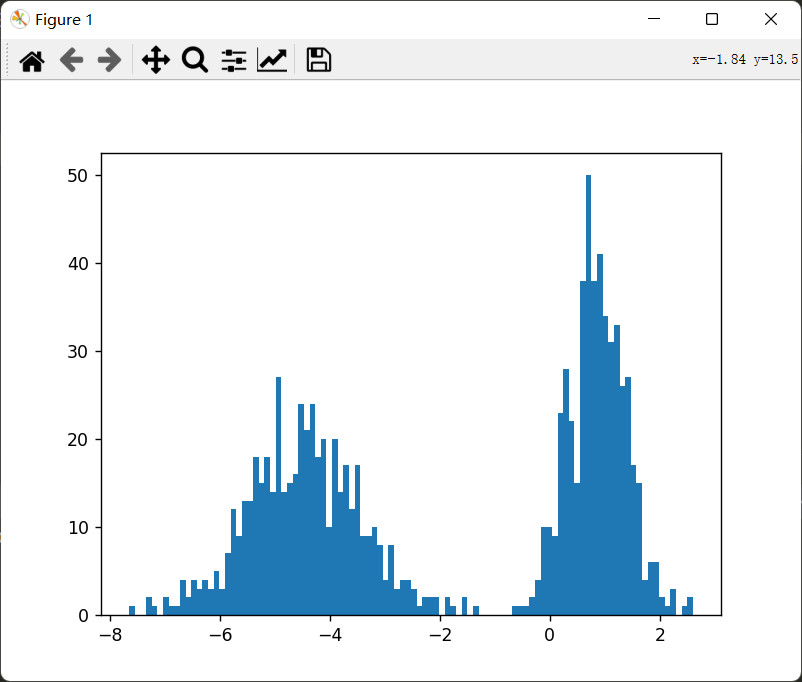
生成1000个数据:特征只有一列,分为两簇,两簇的方差为0.5和1:
1
2
3
4
5
6
7
8
9
import matplotlib.pyplot as pltfrom sklearn.datasets._samples_generator import make_blobscenters = 2 X,y = make_blobs(n_samples=1000 ,n_features=1 ,centers=centers,cluster_std=[0.5 ,1 ],random_state=100 ) plt.hist(X,bins = 100 ) plt.show()
image-20221003133732791
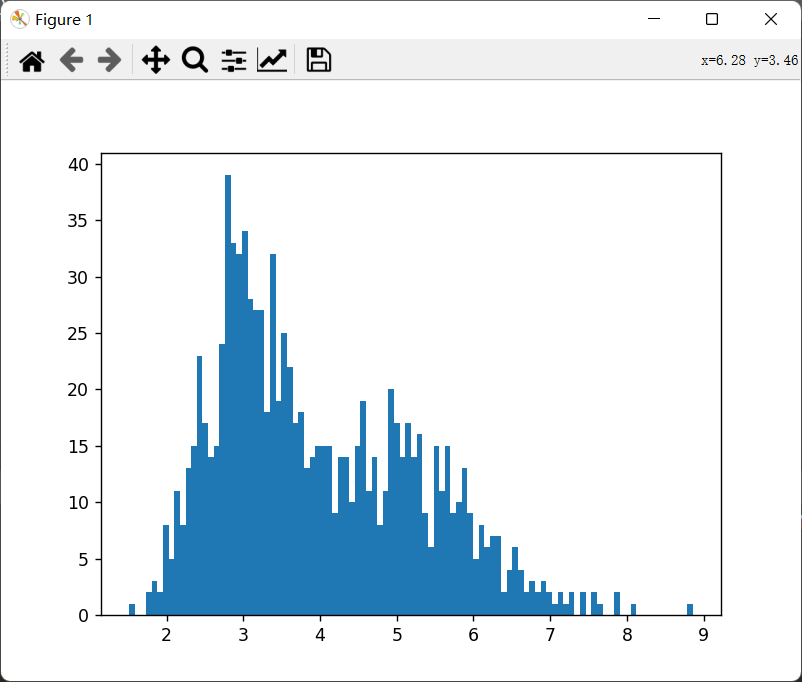
生成1000个数据:特征只有一列,分为两簇,两簇中心点为2和5,方差为0.5和1:
1
2
3
4
5
6
7
8
9
import matplotlib.pyplot as pltfrom sklearn.datasets._samples_generator import make_blobscenters = [[3 ],[5 ]] X,y = make_blobs(n_samples=1000 ,n_features=1 ,centers=centers,cluster_std=[0.5 ,1 ],random_state=100 ) plt.hist(X,bins = 100 ) plt.show()
image-20221003142413580
可以看到上图为两个一维高斯分布混在了一起。接下来将使用上图所示数据集作为我们手动实现GMM的训练集。
GMM算法手动实现(仅对于一维高斯分布)
E-step
对于一维高斯分布概率密度函数,求解: \[
\gamma_t(z_k^{(i)}) =
\frac{\alpha_k^{(t)}N(x|\mu_k^{(t)},\Sigma_k^{(t)})}{\sum_{j=1}^K
\alpha_j^{(t)}N(x|\mu_j^{(t)},\Sigma_j^{(t)})}
\] 其中, \[
N(x|\mu,\Sigma) = \frac
{1}{\sigma\sqrt{2\pi}}e^{-\frac{(x-\mu)^2}{2\sigma^2}}
\]
本来打算把一维高斯分布概率密度函数写成代码的形式,但是途中发现了scipy科学计算包,这里就顺带理一下scipy中的高斯分布使用方法:【Python笔记】Scipy.stats.norm函数解析 。相关参数解释都在这篇文章里了,建议先看文章。当然如果觉得太麻烦了,就直接自己把上面的概率密度函数变成代码形式就好。
1
2
3
4
5
6
7
8
9
10
11
12
13
14
def E_step (data,theta ): Rz = [] Rz1_up = theta['w1' ]*stats.norm(theta['mu1' ],theta['sigma1' ]).pdf(data) Rz2_up = theta['w2' ]*stats.norm(theta['mu2' ],theta['sigma2' ]).pdf(data) Rz_down = theta['w1' ]*stats.norm(theta['mu1' ],theta['sigma1' ]).pdf(data)+theta['w2' ]*stats.norm(theta['mu2' ],theta['sigma2' ]).pdf(data) Rz1 = Rz1_up/Rz_down Rz2 = Rz2_up/Rz_down Rz.append(Rz1) Rz.append(Rz2) Rz = np.array(Rz) return Rz
M-step
计算:
\(\alpha_k^{(t+1)} =
\frac{1}{N}\sum_{i=1}^n\gamma_t(z^{(i)}_k)\)
\(\mu_k^{(t+1)} =
\frac{\sum_{i=1}^n[\gamma_t(z^{(i)}_k)x_i]}{\sum_{i=1}^n\gamma_t(z^{(i)}_k)}\)
\(\Sigma_k^{(t+1)} =
\frac{\sum_{i=1}^n\gamma_t(z^{(i)}_k)(x_n-\mu_k)(x_n-\mu_k)^T}{\sum_{i=1}^n\gamma_t(z^{(i)}_k)}\)
前两个没什么好说明的,最后一个需要注意:因为示例是一维的,所以\(x_n-\mu_k\)
是数字,倒置也是他自己,所以分子后面那一块变成了求平方。另外,\(\Sigma\) 是\(\sigma^2\)
,求出来后需要开平方才是我们需要的\(\sigma\) 。
1
2
3
4
5
6
7
8
def M_step (data,theta,Rz,n ): theta['w1' ] = np.sum (Rz[0 ])/n theta['w2' ] = np.sum (Rz[1 ])/n theta['mu1' ] = np.sum (Rz[0 ]*data)/np.sum (Rz[0 ]) theta['mu2' ] = np.sum (Rz[1 ]*data)/np.sum (Rz[1 ]) Sigma1 = np.sum (Rz[0 ]*np.square(data-theta['mu1' ]))/(np.sum (Rz[0 ])) Sigma2 = np.sum (Rz[1 ]*np.square(data-theta['mu2' ]))/(np.sum (Rz[1 ])) theta['sigma1' ],theta['sigma2' ] = np.sqrt(Sigma1),np.sqrt(Sigma2)
初始化未知参数以及迭代
1
2
3
4
5
6
7
8
9
10
11
12
13
14
15
def run_GMM (data,times ): theta = {} theta['w1' ],theta['w2' ] = 0.5 ,0.5 theta['mu1' ],theta['mu2' ] = 0 ,10 theta['sigma1' ],theta['sigma2' ] = 0.8 ,0.8 n = len (data) data = np.array(data) for t in range (times): Rz = E_step(data,theta) M_step(data,theta,Rz,n) if t % 100 == 0 : print (theta) print ("=========" )
然后我们可以运行看看效果:
1
2
3
4
5
6
7
if __name__ == '__main__' : centers = [[3 ], [5 ]] X_train, y_test = make_blobs(n_samples=1000 , n_features=1 , centers=centers, cluster_std=[0.5 , 1 ], random_state=100 ) run_GMM(data=X_train,times=1000 )
可以看到,最后GMM收敛到了下面所示的值:
1 2 {'w1' : 0.467708978482864, 'w2' : 0.5322910215171359, 'mu1' : 2.9671070095836107, 'mu2' : 4.878609055231818, 'sigma1' : 0.4970731536722904, 'sigma2' : 1.0992431014967026} =========
对比我们生成数据时的各个参数,发现mu和sigma差别都不大。它成功的从高斯混合模型中分离了两个高斯模型。并且与我们最初设置这两个高斯模型的参数差别不大。
绘制可视化动态图像
这部分是可选内容,觉得比较好玩的可以试试。
1
2
3
4
5
6
7
8
9
10
11
12
13
14
15
16
17
def draw_GMM (thetas ): x = np.linspace(0 , 10 , 100 ) fig = plt.figure() ax = fig.add_subplot(1 , 1 , 1 ) plt.ion() for theta in thetas: y_1 = stats.norm(theta['mu1' ], theta['sigma1' ]).pdf(x) y_2 = stats.norm(theta['mu2' ], theta['sigma2' ]).pdf(x) lines1 = ax.plot(x, y_1,c='red' ) lines2 = ax.plot(x, y_2,c='green' ) plt.pause(0.3 ) try : ax.lines.remove(lines1[0 ]) ax.lines.remove(lines2[0 ]) except Exception: pass
完整代码
1
2
3
4
5
6
7
8
9
10
11
12
13
14
15
16
17
18
19
20
21
22
23
24
25
26
27
28
29
30
31
32
33
34
35
36
37
38
39
40
41
42
43
44
45
46
47
48
49
50
51
52
53
54
55
56
57
58
59
60
61
62
63
64
65
66
67
68
69
70
71
72
73
74
import numpy as npimport matplotlib.pyplot as pltfrom sklearn.datasets._samples_generator import make_blobsfrom scipy import statsdef draw_GMM (thetas ): x = np.linspace(0 , 10 , 100 ) fig = plt.figure() ax = fig.add_subplot(1 , 1 , 1 ) plt.ion() for theta in thetas: y_1 = stats.norm(theta['mu1' ], theta['sigma1' ]).pdf(x) y_2 = stats.norm(theta['mu2' ], theta['sigma2' ]).pdf(x) lines1 = ax.plot(x, y_1,c='red' ) lines2 = ax.plot(x, y_2,c='green' ) plt.pause(0.3 ) try : ax.lines.remove(lines1[0 ]) ax.lines.remove(lines2[0 ]) except Exception: pass def E_step (data,theta ): Rz = [] Rz1_up = theta['w1' ]*stats.norm(theta['mu1' ],theta['sigma1' ]).pdf(data) Rz2_up = theta['w2' ]*stats.norm(theta['mu2' ],theta['sigma2' ]).pdf(data) Rz_down = theta['w1' ]*stats.norm(theta['mu1' ],theta['sigma1' ]).pdf(data)+theta['w2' ]*stats.norm(theta['mu2' ],theta['sigma2' ]).pdf(data) Rz1 = Rz1_up/Rz_down Rz2 = Rz2_up/Rz_down Rz.append(Rz1) Rz.append(Rz2) Rz = np.array(Rz) return Rz def M_step (data,theta,Rz,n ): theta['w1' ] = np.sum (Rz[0 ])/n theta['w2' ] = np.sum (Rz[1 ])/n theta['mu1' ] = np.sum (Rz[0 ]*data)/np.sum (Rz[0 ]) theta['mu2' ] = np.sum (Rz[1 ]*data)/np.sum (Rz[1 ]) Sigma1 = np.sum (Rz[0 ]*np.square(data-theta['mu1' ]))/(np.sum (Rz[0 ])) Sigma2 = np.sum (Rz[1 ]*np.square(data-theta['mu2' ]))/(np.sum (Rz[1 ])) theta['sigma1' ],theta['sigma2' ] = np.sqrt(Sigma1),np.sqrt(Sigma2) def run_GMM (data,times ): theta = {} draw_theta = [] theta['w1' ],theta['w2' ] = 0.5 ,0.5 theta['mu1' ],theta['mu2' ] = 0 ,10 theta['sigma1' ],theta['sigma2' ] = 0.8 ,0.8 n = len (data) data = np.array(data) for t in range (times): Rz = E_step(data,theta) M_step(data,theta,Rz,n) if t<=50 : print (theta) print ("=========" ) draw_theta.append(theta.copy()) draw_GMM(draw_theta) if __name__ == '__main__' : centers = [[3 ], [5 ]] X_train, y_test = make_blobs(n_samples=1000 , n_features=1 , centers=centers, cluster_std=[0.5 , 1 ], random_state=100 ) plt.hist(X_train,100 ) plt.show() run_GMM(data=X_train,times=650 )
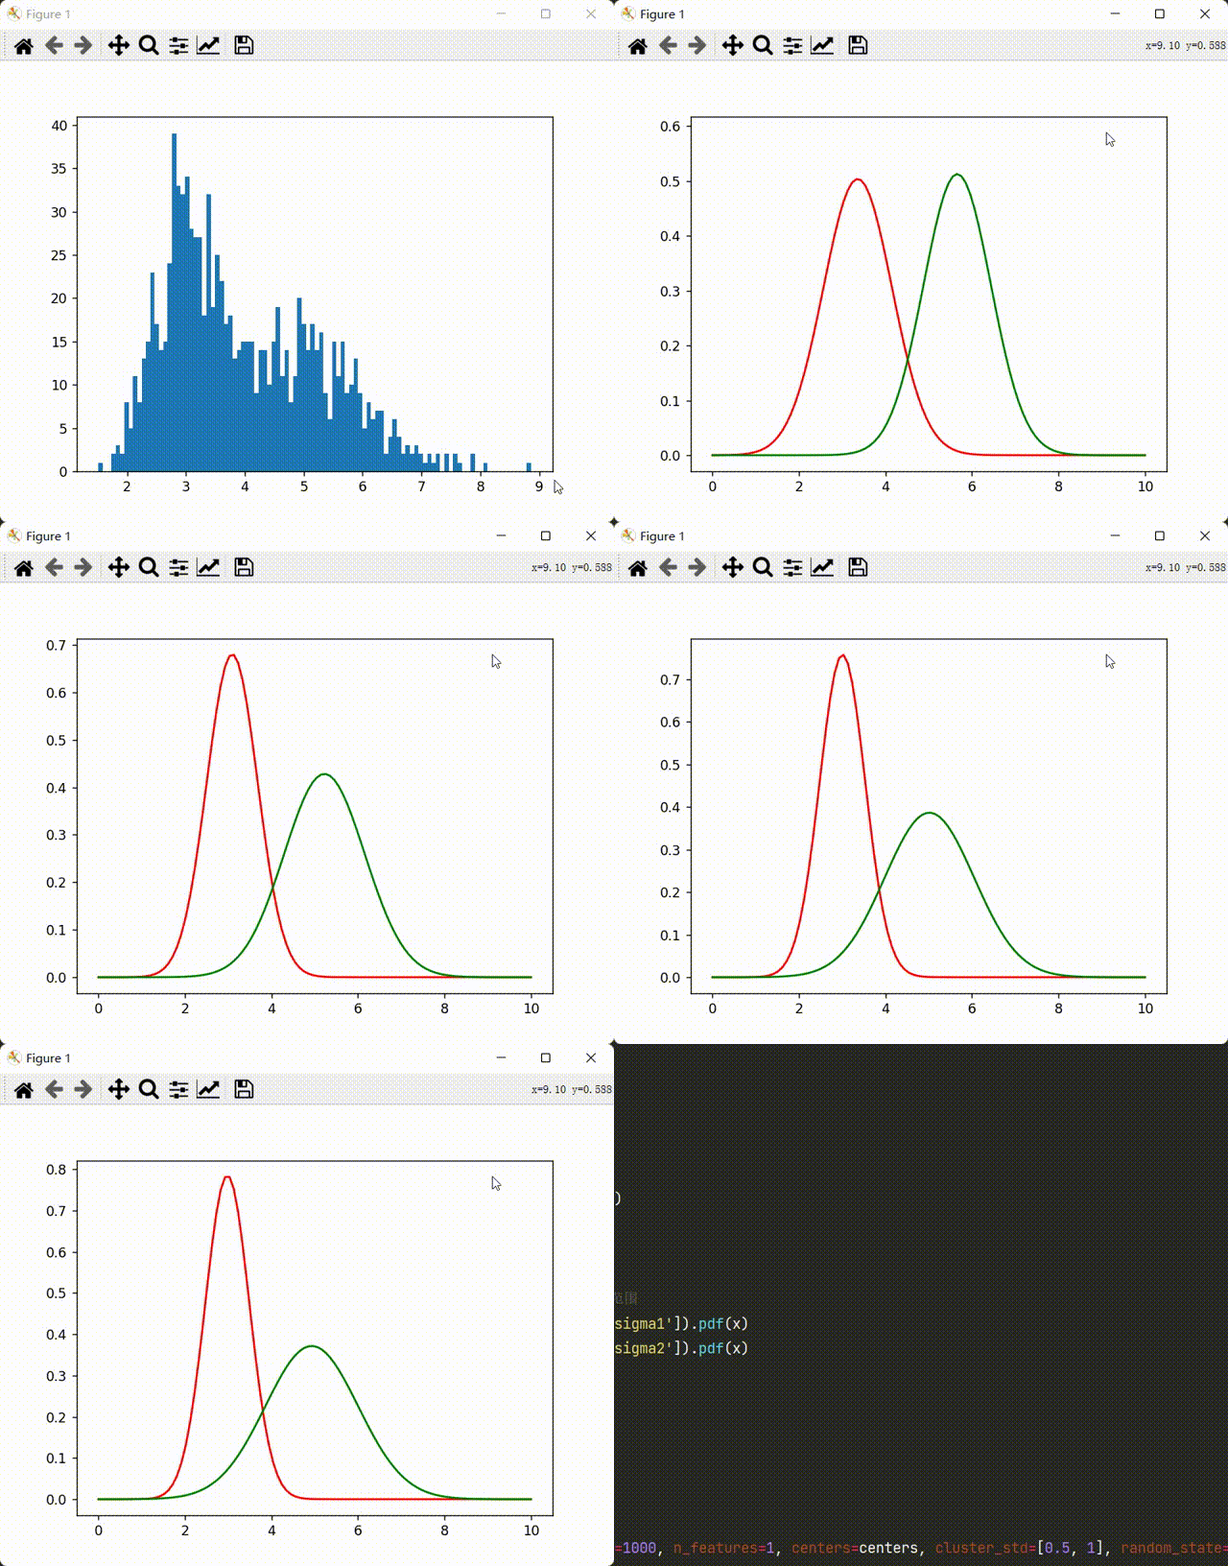
可视化演示
原始数据:
image-20221003142413580
训练结果:
1664799029453
使用sklearn的GMM
又到了令人愉悦的部分了。
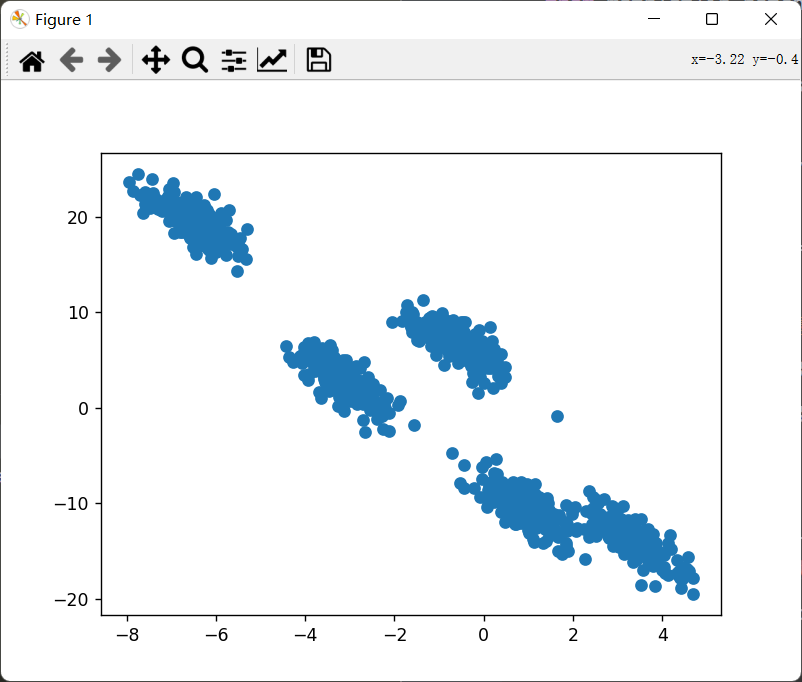
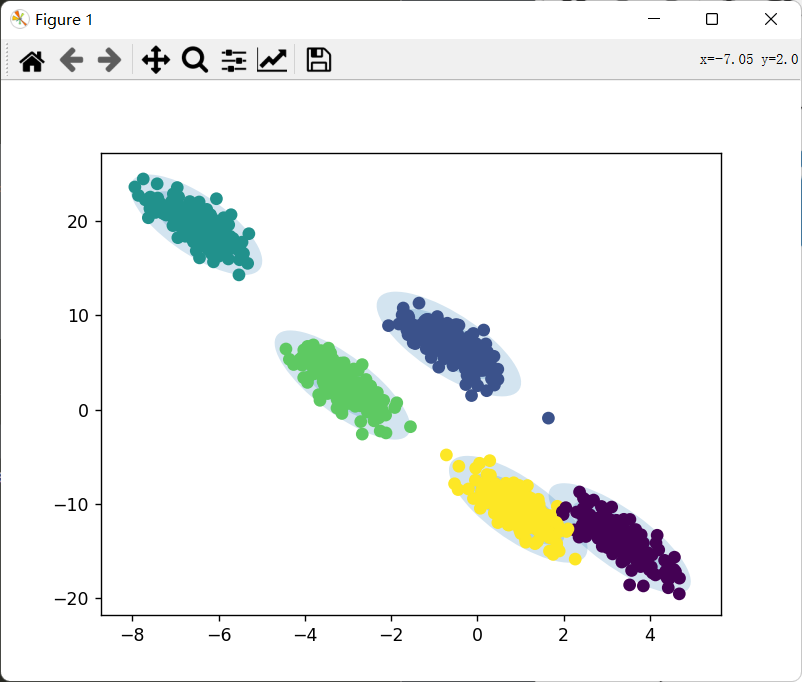
这部分将使用sklearn的GMM来实现聚类,为了便于画图,这里特征只选两个。即二维高斯混合模型。另外顺带一提,如果你稍微查看了sklearn中GMM的源码,就会发现它在初始化时就是先用了一次Kmean。
关于sklearn的GMM用法就不多说了,推荐一篇文章:Scikit-Learn学习笔记——高斯混合模型(GMM)应用:分类、密度估计、生成模型_盐味橙汁的博客-CSDN博客_高斯混合模型分类
这篇文章还说明了GMM在密度估计、生成模型上的应用。
代码
注:绘制边缘椭圆 部分搬的是这篇文章的代码,因为本人还不太会。
1
2
3
4
5
6
7
8
9
10
11
12
13
14
15
16
17
18
19
20
21
22
23
24
25
26
27
28
29
30
31
32
33
34
35
36
37
38
39
40
41
42
43
44
45
46
47
48
49
50
51
import numpy as npimport matplotlib.pyplot as pltfrom matplotlib.patches import Ellipsefrom sklearn.mixture import GaussianMixturefrom sklearn.datasets._samples_generator import make_blobsdef creat_data (centers,size = 1000 ): X,labels = make_blobs(n_samples=size,n_features=2 ,centers=centers,cluster_std=1 ,random_state=100 ) rng = np.random.RandomState(12 ) X = np.dot(X, rng.randn(2 , 2 )) return X,labels def draw_ellipse (position, covariance, ax=None , **kwargs ): """用给定的位置和协方差画一个椭圆""" ax = ax or plt.gca() if covariance.shape == (2 , 2 ): U, s, Vt = np.linalg.svd(covariance) angle = np.degrees(np.arctan2(U[1 , 0 ], U[0 , 0 ])) width, height = 2 * np.sqrt(s) else : angle = 0 width, height = 2 * np.sqrt(covariance) for nsig in range (1 , 4 ): ax.add_patch(Ellipse(position, nsig * width, nsig * height, angle, **kwargs)) def plot_gmm (gmm, X,labels, label=True , ax=None ): ax = ax or plt.gca() if label: ax.scatter(X[:, 0 ], X[:, 1 ], c=labels, s=40 , cmap='viridis' , zorder=2 ) else : ax.scatter(X[:, 0 ], X[:, 1 ], s=40 , zorder=2 ) w_factor = 0.2 / gmm.weights_.max () for pos, covar, w in zip (gmm.means_, gmm.covariances_, gmm.weights_): draw_ellipse(pos, covar, alpha=w * w_factor) plt.show() if __name__ == '__main__' : centers = 5 X,labels = creat_data(centers = centers) model = GaussianMixture(n_components = centers,covariance_type='full' ) model.fit(X) labels_predict = model.predict(X) plot_gmm(model, X,labels_predict)
原始数据:
image-20221004202410089
经过聚类后的数据:
image-20221004202456739
